
LYNX — Quick Start & Best Practices
LYNX discovers human-readable formulas (symbolic regression) that predict one output column from up to 100 input columns in your CSV. Load your data, pick inputs/outputs, and watch LYNX iterate toward the best equation while showing progress live.
Before you start (data checklist)
Your CSV should have:
- Headers: A name in the first row for every column.
- One output column: The value you want LYNX to predict.
- Input columns: Up to 100 columns you want LYNX to consider.
- No blanks/NULLs/NaN: Fill or remove missing values first.
- Numeric data: Non-numeric text must be converted to numbers.
Example
If, for example, the true relationship is y = m*x + b, your file might have headers:
y, m, x, and b (and rows of numeric values). LYNX will try operator combinations to rediscover that line.
1) Load your CSV
Click Load CSV and choose your file. LYNX reads the headers and prepares your columns for selection.
2) Choose inputs & output
- In Input Columns, check every column that should be used as a predictor (do not check the output here).
- In Output Variable, select the single target column.
Example
Inputs: y, m, x (all checked)
Output: x (selected in the dropdown)

3) Start the search
Click Start. LYNX generates a random, valid formula and begins improving it.
- Pause: Temporarily stop processing. Click Resume to continue from the same state (while the app remains open).
- Stop: End the current run if you want to change inputs or try different operators.
Automatic restart on stagnation:
If no better formula is found for 60 seconds, LYNX restarts with a fresh candidate to escape local minima. (Your charts and Top-10 still keep the best results discovered so far.)
Automatic finish:
If the error reaches zero (or below a tiny threshold), LYNX pops up “Algorithm Found!” and stops.
4) Read the live results
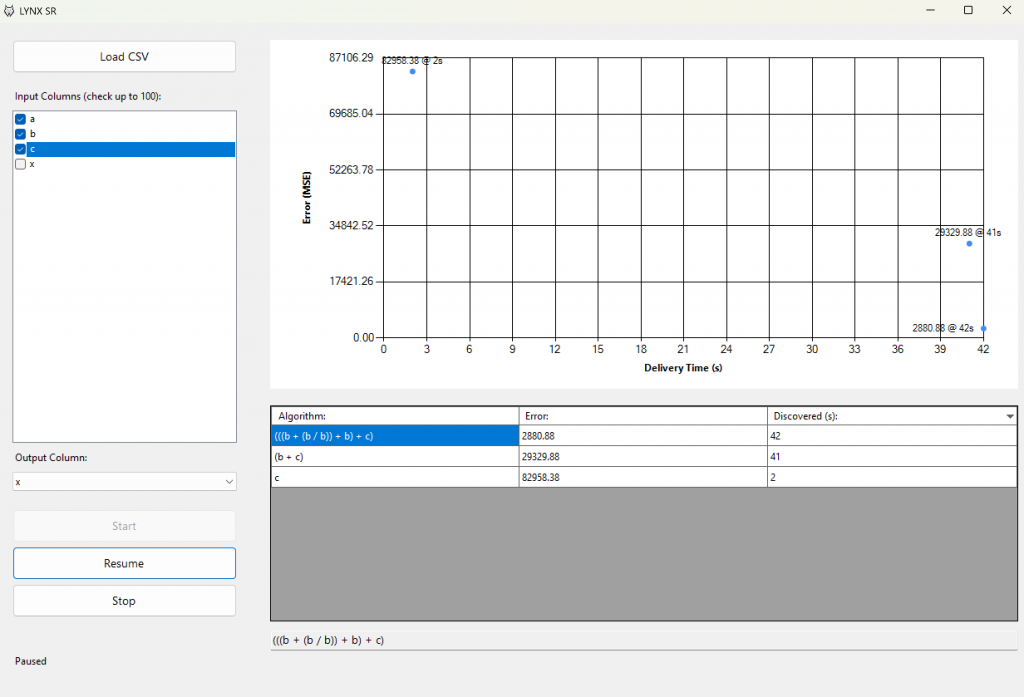
Top-10 Chart (upper-right)
Shows your ten most accurate formulas as points, labeled with their error and the elapsed seconds when they were found. The time axis shows up to 20 tick marks at once and scales automatically as more time passes.
Top-10 Table (below the chart)
- Ranks the best formulas with their error (e.g., MSE or R²-based metric) and the “Discovered (s)” time.
- Expressions are simplified (e.g.,
4+3becomes7) so they’re easy to read and copy. - The single best formula appears at the bottom for quick copy/paste.
Tip: If two formulas have similar error, prefer the simpler one. It’s usually more robust.
Best practices (for faster, better results)
- Start simple: Give LYNX only the operators you think are necessary (add/subtract/multiply/divide, then expand if needed).
- Scale your inputs: Features on similar scales can make the search smoother.
- Remove outliers: Extreme values can dominate error and mislead the search.
- Choose meaningful inputs: Don’t include columns you know are irrelevant; they just expand the search space.
- Try multiple runs: If you suspect a complex relationship, a few restarts can converge faster than one long run.
Common pitfalls (and quick fixes)
- “My CSV loads, but nothing improves.”
Check that your output really depends on the selected inputs. Also confirm no hidden text/nulls remain. - “The chart looks empty.”
Wait for the first discoveries, or confirm the Y-axis isn’t zero-range (it auto-expands as new points are added). - “I see odd formulas.”
That’s normal during exploration. LYNX constantly mutates expressions; only the Top-10 represent the best found so far.
What LYNX is doing under the hood (plain English)
- Restarts automatically after 60s without improvement.
- Starts with a random valid formula built from your inputs and allowed operators.
- Evaluates error over your entire dataset (lower is better).
- Applies small mutations (swap tokens, insert/remove operators or constants, tweak constants ±~1%).
- Keeps improvements (greedy selection) and maintains a Top-10 leaderboard.
- Simplifies each expression (constant folding, e.g.,
4+3 → 7;removes duplicates like++).